A) P0-P2.
B) P2-P8.
C) P2-P5.
D) P5-P8.
F) None of the above
Correct Answer

verified
Correct Answer
verified
Multiple Choice
Figure 8-2
The vertical distance between points A and B represents a tax in the market. 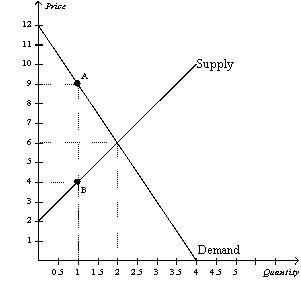 -Refer to Figure 8-2.Producer surplus without the tax is
A) $4,and producer surplus with the tax is $1.
B) $4,and producer surplus with the tax is $3.
C) $10,and producer surplus with the tax is $1.
D) $10,and producer surplus with the tax is $3.
F) B) and D)
Correct Answer

verified
Correct Answer
verified
True/False
The more elastic the supply,the larger the deadweight loss from a tax,all else equal.
B) False
Correct Answer

verified
Correct Answer
verified
Multiple Choice
Figure 8-6
The vertical distance between points A and B represents a tax in the market. 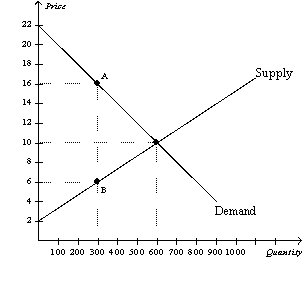 -Refer to Figure 8-6.When the tax is imposed in this market,the price sellers effectively receive is
A) $4.
B) $6.
C) $10.
D) $16.
F) None of the above
Correct Answer

verified
Correct Answer
verified
Multiple Choice
Figure 8-10 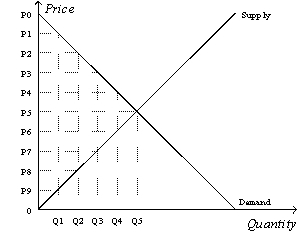 -Refer to Figure 8-10.Suppose the government imposes a tax that reduces the quantity sold in the market after the tax to Q2.With the tax,the producer surplus is
A) (P5-0) x Q5.
B) x (P5-0) x Q5.
C) (P8-0) x Q2.
D) x (P8-0) x Q2.
F) A) and B)
Correct Answer

verified
Correct Answer
verified
Essay
Using demand and supply diagrams,show the difference in deadweight loss between (a)a market with inelastic demand and supply and (b)a market with elastic demand and supply.
Correct Answer

verified
Correct Answer
verified
Multiple Choice
Figure 8-2
The vertical distance between points A and B represents a tax in the market.  -Refer to Figure 8-2.The imposition of the tax causes the quantity sold to
A) increase by 1 unit.
B) decrease by 1 unit.
C) increase by 2 units.
D) decrease by 2 units.
F) A) and C)
Correct Answer

verified
Correct Answer
verified
Multiple Choice
Figure 8-1 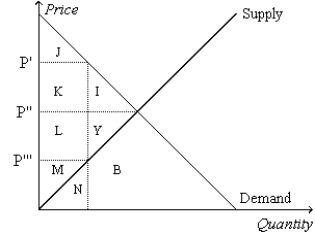 -Refer to Figure 8-1.Suppose the government imposes a tax of P' - P'''.The area measured by I+Y represents the
A) deadweight loss due to the tax.
B) loss in consumer surplus due to the tax.
C) loss in producer surplus due to the tax.
D) total surplus before the tax.
F) All of the above
Correct Answer

verified
Correct Answer
verified
Multiple Choice
Figure 8-17
The vertical distance between points A and B represents the original tax. 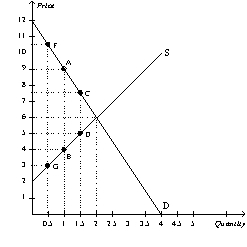 -Refer to Figure 8-17.The original tax can be represented by the vertical distance AB.Suppose the government is deciding whether to lower the tax to CD or raise it to FG.Which of the following statements is correct?
A) Compared to the original tax,the larger tax will decrease both tax revenue and deadweight loss.
B) Compared to the original tax,the smaller tax will increase both tax revenue and deadweight loss.
C) Compared to the original tax,the larger tax will decrease tax revenue and increase deadweight loss.
D) Both a and b are correct.
F) B) and D)
Correct Answer

verified
Correct Answer
verified
Multiple Choice
To measure the gains and losses from a tax on a good,economists use the tools of
A) macroeconomics.
B) welfare economics.
C) international-trade theory.
D) circular-flow analysis.
F) A) and B)
Correct Answer

verified
Correct Answer
verified
Multiple Choice
A $3.50 tax per gallon of paint placed on the sellers of paint will shift the supply curve
A) downward by exactly $3.50.
B) downward by less than $3.50.
C) upward by exactly $3.50.
D) upward by less than $3.50.
F) B) and D)
Correct Answer

verified
Correct Answer
verified
Multiple Choice
Figure 8-4
The vertical distance between points A and B represents a tax in the market. 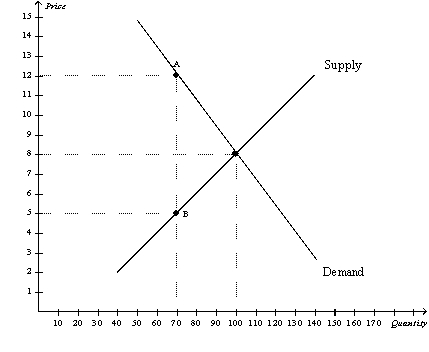 -Refer to Figure 8-4.The price that buyers effectively pay after the tax is imposed is
A) $12.
B) between $8 and $12.
C) between $5 and $8.
D) $5.
F) A) and D)
Correct Answer

verified
Correct Answer
verified
True/False
A tax on a good causes the size of the market to shrink.
B) False
Correct Answer

verified
Correct Answer
verified
Multiple Choice
If a tax shifts the supply curve downward (or to the right) ,we can infer that the tax was levied on
A) buyers of the good.
B) sellers of the good.
C) both buyers and sellers of the good.
D) We cannot infer anything because the shift described is not consistent with a tax.
F) B) and C)
Correct Answer

verified
Correct Answer
verified
Multiple Choice
Figure 8-7
The vertical distance between points A and B represents a tax in the market. 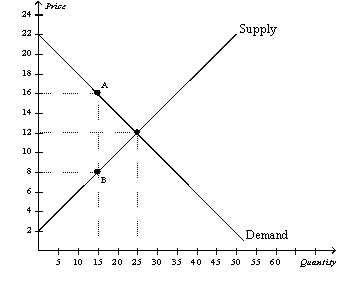 -Refer to Figure 8-7.As a result of the tax,buyers effectively pay
A) $16 for each unit of the good,and sellers effectively receive $12 for each unit of the good.
B) $16 for each unit of the good,and sellers effectively receive $8 for each unit of the good.
C) $12 for each unit of the good,and sellers effectively receive $8 for each unit of the good.
D) $14 for each unit of the good,and sellers effectively receive $10 for each unit of the good.
F) A) and B)
Correct Answer

verified
Correct Answer
verified
Multiple Choice
Suppose a tax is imposed on the sellers of fast-food French fries.The burden of the tax will
A) fall entirely on the buyers of fast-food French fries.
B) fall entirely on the sellers of fast-food French fries.
C) be shared equally by the buyers and sellers of fast-food French fries.
D) be shared by the buyers and sellers of fast-food French fries but not necessarily equally.
F) C) and D)
Correct Answer

verified
Correct Answer
verified
Multiple Choice
Figure 8-2
The vertical distance between points A and B represents a tax in the market.  -Refer to Figure 8-2.The loss of producer surplus associated with some sellers dropping out of the market as a result of the tax is
A) $0.
B) $1.
C) $2.
D) $3.
F) A) and C)
Correct Answer

verified
Correct Answer
verified
Multiple Choice
The size of the deadweight loss generated from a tax is affected by the
A) elasticities of both supply and demand.
B) elasticity of demand only.
C) elasticity of supply only.
D) total revenue collected by the government.
F) A) and C)
Correct Answer

verified
Correct Answer
verified
Multiple Choice
Which of the following scenarios is not consistent with the Laffer curve?
A) The tax rate is very low,and tax revenue is very low.
B) The tax rate is very high,and tax revenue is very low.
C) The tax rate is very high,and tax revenue is very high.
D) The tax rate is moderate (between very high and very low) ,and tax revenue is relatively high.
F) B) and D)
Correct Answer

verified
Correct Answer
verified
Multiple Choice
The graph that represents the amount of deadweight loss (measured on the vertical axis) as a function of the size of the tax (measured on the horizontal axis) looks like
A) a U.
B) an upside-down U.
C) a horizontal straight line.
D) an upward-sloping curve.
F) B) and D)
Correct Answer

verified
Correct Answer
verified
Showing 61 - 80 of 421
Related Exams