A) ![]()
B) ![]()
C) ![]()
D) ![]()
F) B) and C)
Correct Answer

verified
Correct Answer
verified
Multiple Choice
Which of the following would not shift the supply curve for mp3 players?
A) an increase in the price of mp3 players
B) a decrease in the number of sellers of mp3 players
C) an increase in the price of plastic, an input into the production of mp3 players
D) an improvement in the technology used to produce mp3 players
F) B) and D)
Correct Answer

verified
Correct Answer
verified
Multiple Choice
If a good is normal, then an increase in income will result in a(n)
A) increase in the demand for the good.
B) decrease in the demand for the good.
C) movement down and to the right along the demand curve for the good.
D) movement up and to the left along the demand curve for the good.
F) None of the above
Correct Answer

verified
Correct Answer
verified
Multiple Choice
Which of the following is the least likely to be a competitive market?
A) ice cream
B) soybeans
C) cable television
D) new houses
F) B) and C)
Correct Answer

verified
Correct Answer
verified
Multiple Choice
What will happen to the equilibrium price and quantity of new cars if the price of gasoline rises, the price of steel rises, public transportation becomes cheaper and more comfortable, and auto-workers negotiate higher wages?
A) Price will fall, and the effect on quantity is ambiguous.
B) Price will rise, and the effect on quantity is ambiguous.
C) Quantity will fall, and the effect on price is ambiguous.
D) Quantity will rise, and the effect on price is ambiguous.
F) A) and D)
Correct Answer

verified
Correct Answer
verified
Multiple Choice
The supply curve for portable charcoal grills shifts
A) only when production technology changes.
B) when a determinant of the supply of portable charcoal grills other than the price of portable charcoal grills changes.
C) when any determinant of the supply of portable charcoal grills changes.
D) only when the number of sellers of portable charcoal grills changes.
F) B) and D)
Correct Answer

verified
Correct Answer
verified
Multiple Choice
Figure 4-13 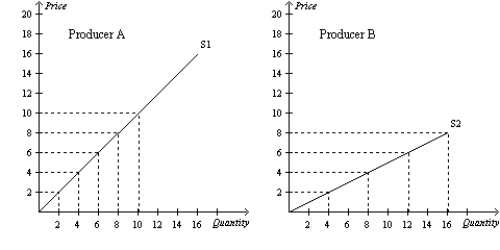 -Refer to Figure 4-13. If Producer A and Producer B are the only producers in the market, then the market quantity supplied when the price is $2 is
A) 4 units.
B) 6 units.
C) 8 units.
D) 10 units.
F) None of the above
Correct Answer

verified
Correct Answer
verified
Multiple Choice
What would happen to the equilibrium price and quantity of lattés if coffee shops began using a machine that reduced the amount of labor necessary to produce them?
A) Both the equilibrium price and quantity would increase.
B) Both the equilibrium price and quantity would decrease.
C) The equilibrium price would increase, and the equilibrium quantity would decrease.
D) The equilibrium price would decrease, and the equilibrium quantity would increase.
F) None of the above
Correct Answer

verified
Correct Answer
verified
Multiple Choice
Table 4-4
 -Refer to Table 4-4. Suppose the market consists of Adam and Barb only. If the price rises by $2, the quantity demanded in the market falls by
A) 4 units.
B) 6 units.
C) 8 units.
D) 10 units.
F) None of the above
Correct Answer

verified
Correct Answer
verified
Multiple Choice
Holding the nonprice determinants of demand constant, a change in price would
A) result in either a decrease in demand or an increase in demand.
B) result in a movement along a stationary demand curve.
C) result in a shift of supply.
D) have no effect on the quantity demanded.
F) A) and B)
Correct Answer

verified
Correct Answer
verified
Multiple Choice
Suppose there are six bait and tackle shops that sell worms in a lakeside resort town in Minnesota. If we add the respective quantities that each shop would produce and sell at each of the six bait and tackle shops when the price of worms is $2 per bucket, $2.50 per bucket, and $3 per bucket, and so forth, we have found the
A) market demand curve.
B) market supply curve.
C) equilibrium curve.
D) surplus or shortage depending on market conditions.
F) None of the above
Correct Answer

verified
Correct Answer
verified
Multiple Choice
An increase in quantity supplied
A) results in a movement downward and to the left along a fixed supply curve.
B) results in a movement upward and to the right along a fixed supply curve.
C) shifts the supply curve to the left.
D) shifts the supply curve to the right.
F) None of the above
Correct Answer

verified
Correct Answer
verified
Multiple Choice
An increase in the price of a good would
A) increase the supply of the good.
B) increase the amount purchased by buyers.
C) give producers an incentive to produce more.
D) decrease both the quantity demanded of the good and the quantity supplied of the good.
F) None of the above
Correct Answer

verified
Correct Answer
verified
Multiple Choice
If the demand for a good falls when income falls, then the good is called a(n) 
A) normal good.
B) regular good.
C) luxury good.
D) inferior good.
F) A) and D)
Correct Answer

verified
Correct Answer
verified
Multiple Choice
Suppose an increase in the price of rubber coincides with an advance in the technology of tire production. As a result of these two events, the demand for tires
A) decreases, and the supply of tires increases.
B) is unaffected, and the supply of tires decreases.
C) is unaffected, and the supply of tires increases.
D) None of the above is necessarily correct.
F) B) and D)
Correct Answer

verified
Correct Answer
verified
Multiple Choice
Figure 4-18 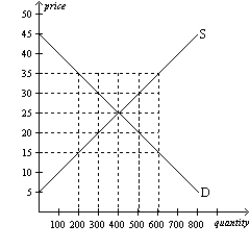 -Refer to Figure 4-18. At what price would there be an excess demand of 200 units of the good?
A) $15
B) $20
C) $30
D) $35
F) None of the above
Correct Answer

verified
Correct Answer
verified
Multiple Choice
Figure 4-20 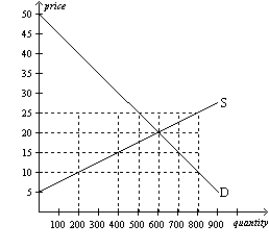 -Refer to Figure 4-20. At a price of $15,
A) quantity demanded exceeds quantity supplied.
B) there is a shortage.
C) there is an excess demand.
D) All of the above are correct.
F) A) and D)
Correct Answer

verified
Correct Answer
verified
Multiple Choice
Figure 4-24
The diagram below pertains to the demand for turkey in the United States. 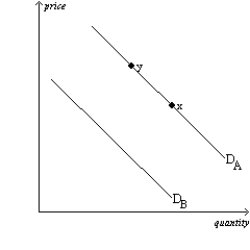 -Refer to Figure 4-24. All else equal, a sale on chicken would cause a move from
A) DA to DB.
B) DB to Db.
C) x to y.
D) y to x.
F) None of the above
Correct Answer

verified
Correct Answer
verified
Multiple Choice
Figure 4-4
Yasmine Mercedes
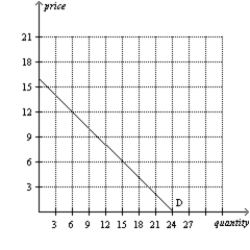
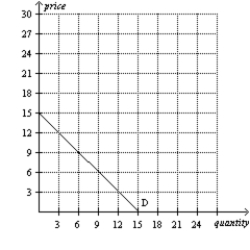 -Refer to Figure 4-4. Which of the following statements is correct?
A) If the price is $6, the market quantity demanded is 15 units.
B) If the price is $9, the market quantity demanded is 24 units.
C) If the price is $12, the market quantity demanded is 9 units.
D) If the price is $15, the market quantity demanded is 39 units.
F) B) and D)
Correct Answer

verified
Correct Answer
verified
Short Answer
Table 4-16
The following table shows the supply and demand schedules in a market.
 -Refer to Table 4-16. At a price of $2, will there be a surplus or shortage of units in this market?
Correct Answer

verified
Correct Answer
verified
Showing 401 - 420 of 698
Related Exams